There are often grey areas in the order-to-delivery chain of in-house logistics where system data does not match reality. Transval is developing data-driven digital tools to improve information flow and processes and make work easier.
Text by Anne Penttilä, photos by Transval, Getty Images
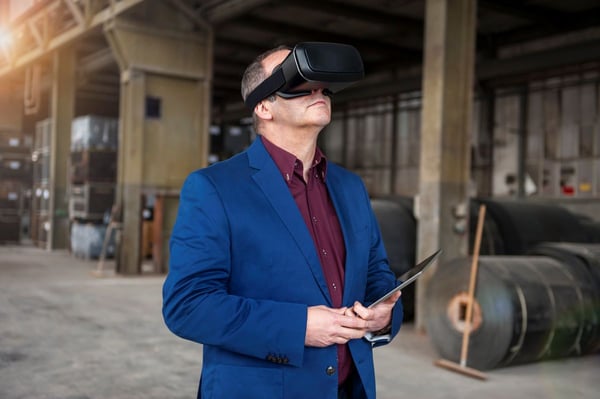
The grey areas in the order-to-delivery chain of content logistics services and operations are prone to causing various problems and delays in production. Grey areas arise especially when the system data generated from the service does not correspond to reality, says Riku Koskimaa, Transval's operational manager for industrial services.
- For example, a product may have already arrived, but in practice it has not been received because the receipt information is missing. In the ERP, there may be information that the product arrived a week ago, even though the product has not physically arrived. The supplier asks for payment and Purchasing asks where the product is because the product has been declared as received but no receipt has been made. According to Koskimaa, the most common reason is that information does not flow well enough between the different actors and stages of the process. ERP can also create constraints in processes.
- For example, in ERP there is an estimated arrival time when production expects the product to arrive, but it does not. Or products arrive in several batches, which can lead to a very long lead time for receipt in the system: for example, a week from the arrival of the first shipment of a delivery to the arrival of the last batch, with no information on this.
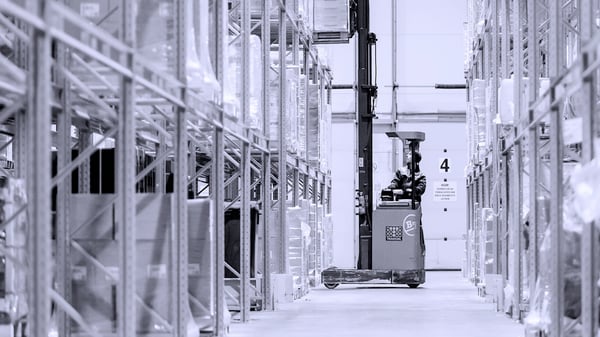
Transval identified the need to measure and make visible the whole process from the arrival of the products in the warehouse to the moment they are received in the WMS or ERP system and shelved. The problem was addressed by building a practical application that visualizes the processes and data.
Visual work queue view
Building the application started with the visualisation of the processes and information in the receiving area. A visual work queue view was created as an easy-to-use tool for in-house logistics work. The application provides real-time information on when products actually arrived at the warehouse, when they were received, shelved, and are ready for use. Upon receipt, the product is identified and the identification data is combined with the necessary data: time stamp, images, deviation and location data. The data is updated as the product moves forward in the process. The product is moved from one step to the next in the work queue view according to the progress of the work. It shows graphically, by colour coding, where in the process the product is going, how long the work step is taking, whether the product is on time or late for the next step, and by how much.
- The main benefit of the visualisation is real-time, there is no need for separate reporting, and the status of the different work steps can be seen at a glance. It reduces unnecessary work. At the same time, anomaly data also accumulates. Anomalies are highlighted immediately, so the ability to react to them is improved. In this way, information on security of supply and suggestions for improvement can be gathered to support the customer's procurement organisation.
Lazy suppliers in the "watch list"
Security of supply is more than just the timely arrival of the agreed product. Deviation data can be collected by scoring deliveries on receipt. Lower scores are given to deliveries that are missing products, have imperfect labelling, poor packaging or are mixed up on the pallet.
Over time, supplier-specific data on the quality of deliveries will start to accumulate. Often, a supplier with low scores can be put in a 'watch list' so that efforts can be made to improve the quality of deliveries in the future. High scoring suppliers, on the other hand, become a baseline for the normal process to which all suppliers should aspire in the future.
- In this way, KPIs (key performance indicators) can be linked to real-time data. Yet this is just a glimpse of all the possibilities that digitalization brings," says Koskimaa.
Low-code software and low-cost equipment
Transval has built the application using so-called low-code software. These are automated, code-generating programs that, compared to traditional software, are easy, fast, extensible and customisable. They have extensive data transfer and sharing capabilities via cloud services. They are easy, cheap and flexible to use compared to traditional heavy software, which takes time to build, requires external expertise, is more expensive to maintain and inflexible to changing needs.
The application is also mobile and can be deployed in a couple of days. Multiple versions can be built for different needs and desired functionality.
- Of course, applications are not a replacement for ERP or WMS systems, their role is to collect simple data that is stored and analysed.
Transval makes use of Microsoft software, such as Power apps. For example, Power BI combines data queries and modelling, Flow shows automated workflow and Forms provides electronic forms. Other Office tools and Monday project management are also used. In addition to software, "hardware" is also commonplace: inexpensive mobile phones and tablets and barcode scanners can be used as terminals. The work queue is displayed on a TV monitor at the workstation. The equipment is easy to use and does not require a large investment.
Identified as a necessity
The system described above was introduced in a Transval client company three years ago. Initially, the employees were a little reluctant - yet another new system.
- After a while, there was a slight pause in its use due to upgrades. The employees immediately started sending messages of concern - the application had apparently been perceived as necessary," says Markku Viljanen, Transval's Development Manager.
The app also makes it easy to share information, with both employees and supervisors having their own views on the app. The application also provides the customer with his own reporting view, from which he can receive reports on the use of premises and packaging materials, for example, as well as on the work performed.
- For example, Transval's packaging department might be notified of a delivery discrepancy in the customer's view during the night, allowing them to investigate the situation first thing in the morning.
Transval has also piloted indoor location tracking with its customers, which allows them to know the location of the product in a particular warehouse and area of the warehouse. By being able to visualize and compare product locations and movements, more information about the indoor logistics process can be gained. The intention is to further develop this functionality and combine it with response data from the visual work queue view.